By their very nature distributed platforms, applications and services running in the cloud are comprised of many moving parts. In this post we’ll see just how simple it is to add powerful & unified monitoring to your Azure Service Fabric clusters by integrating with the Azure Monitor service (formerly known as Azure Log Analytics). We’ll also touch upon a few Azure Service Fabric / Azure Monitor best practices from the field.
To start off, Azure Monitor provides a single, cost effective & integrated experience for monitoring Azure resources and hybrid environments. It helps with maximizing operational availability, performance & resource utilization of your VMs and containers by collecting, analyzing and acting on both platform and application level telemetry.
Data collected by Azure Monitor fits into two groups, metrics and logs:
Metrics: are numerical values that describe some aspect of a system at a particular point in time. They are lightweight and capable of supporting near real-time scenarios.
Logs: contain different kinds of data organized into records with different sets of properties for each type. Telemetry such as events and traces are stored as logs in addition to performance data so that it can all be combined for analysis.
Log Analytics agent
For advanced Azure Service Fabric monitoring scenarios we’ll forgo the usual recommendation of using the Azure Diagnostics extension (commonly referred to as the Windows Azure Diagnostic (WAD) or Linux Azure Diagnostic (LAD) extension) and instead opt to leverage the more flexible Log Analytics agent. I like to think of the Log Analytics agent as just another microservice which runs on all Service Fabric nodes but first we need to make it part of the Virtual Machine Scale Set (VMSS).
The Log Analytics agent was developed for comprehensive management across on-premises physical and virtual machines, containers and VMs hosted in other clouds. The Windows and Linux agents connect to a Log Analytics workspace in Azure Monitor to collect both monitoring solution-based data as well as custom data sources that you configure.
Adding the Log Analytics agent to the Virtual Machine Scale Set (VMSS)
I’ve assumed you have an Azure Monitor Log Analytics workspace already set-up, but if you don’t then head over to Create a Log Analytics workspace in the Azure portal.
The easiest way to add the Log Analytics agent to the underlying Service Fabric Virtual Machine Scale Set (VMSS) is to use the Cloud Shell or Azure CLI. The following official documentation from the Azure Service Fabric team does a great job of explaining the process step by step: Add the agent extension via Azure CLI.
Note that the Log Analytics agent can also be added directly to an Azure Service Fabric cluster Resource Manager template in case of standing-up new clusters, thus configured with Azure Monitor integration from the get-go.
For bonus points, if you prefer PowerShell and having tested it, a great community contribution from Nilay Parikh performs the task just as well: Add-OMSAgentVmssExtension:
.\Add-OMSAgentVmssExtension.ps1 -ResourceGroupLocation "location" -ResourceGroupName "yourresourcegroup" -WorkspaceName "omsworkspacename" -VMScaleSetName "scalesetname" -AutoUpgradeMinorVersion
Following the above steps, the Log Analytics agent is now part of your Service Fabric Virtual Machine Scale Set (VMSS), with any running nodes upgraded, a process that usually takes 20 minutes. Note that the upgrade is performed in a rolling manner, and if your durability level supports it, with zero downtime to your application. Any new nodes created as a result of cluster scaling operations will likewise have the Log Analytics agent automatically deployed.
Azure Service Fabric Performance Counters
With the Log Analytics agent successfully running on each Service Fabric node, we are now ready to start collecting metrics and logs. Luckily for us the Log Analytics agent comes with an understated feature, a built in control plane, meaning we can configure at will which metrics and logs we wish to collect, and at what interval via the Azure Portal.
To do so, in the Azure portal go to the resource group in which you created the Service Fabric Analytics solution. Select the name of your Analytics Workspace:
- Click Advanced Settings.
- Click Data, then click Windows or Linux Performance Counters.
- Select from default / custom performance counters.
- Click Save, then click OK.
Refer to official documentation for a full list of recommended Azure Service Fabric cluster performance counters. In addition Service Fabric generates a substantial amount of custom performance counters:
Note: The number of stateful service partitions has a direct correlation to the volume of metrics collected per service. For example an increase in partitions from 5 to 25 would yield a similar jump in volume of metrics and cost of Azure Monitor. As a result, carefully consider and tune the interval for collection of high volume Azure Service Fabric custom performance counters.
Analytics & diagnostics
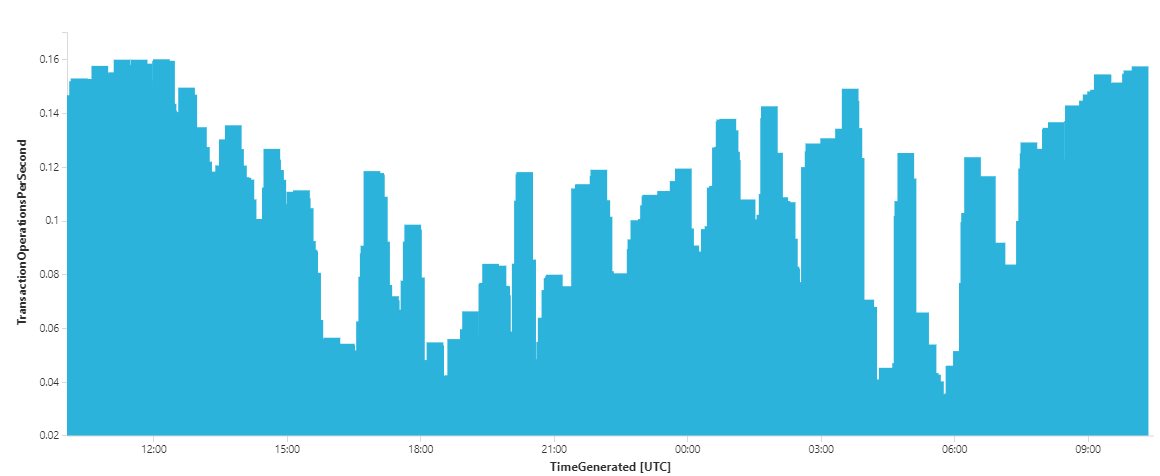
Having configured which performance counters the Log Analytics agent collects, within seconds the data is available in the Azure Monitor workspace for alerting, analytics & diagnostic purposes. For example, we can now visualize the number of Reliable Service new write transactions created per second across the cluster. Select the name of your Analytics Workspace:
- Click Logs.
- Execute the below Kusto query & click CHART:
Perf
| where ObjectName == "Service Fabric Transactional Replicator" and CounterName == "Begin Txn Operations/sec"
| summarize TransactionOperationsPerSecond = avg(CounterValue) by bin(TimeGenerated, 1m)
Summary
In this post, we’ve learned how simple it is to add powerful & unified platform monitoring to your Azure Service Fabric clusters by integrating with the Azure Monitor service. We deployed & configured the Log Analytics agent using the recommended default and custom performance counters, and hopefully highlighted the correlation of stateful service partitions to Azure Monitor cost. Lastly we crafted our very first Log Analytics Kusto query! In future posts we’ll expand our focus to also cover application level telemetry.
References
- https://docs.microsoft.com/en-us/azure/service-fabric/service-fabric-diagnostics-oms-agent
- https://docs.microsoft.com/en-us/azure/azure-monitor/learn/quick-create-workspace
- https://github.com/nilayparikh/AzureScripts/tree/master/Add-OMSAgentVmssExtension
- https://docs.microsoft.com/en-us/azure/service-fabric/service-fabric-diagnostics-event-generation-perf
- https://docs.microsoft.com/en-us/azure/service-fabric/service-fabric-reliable-services-diagnostics
- https://docs.microsoft.com/en-us/azure/service-fabric/service-fabric-reliable-serviceremoting-diagnostics
- https://docs.microsoft.com/en-us/azure/service-fabric/service-fabric-reliable-actors-diagnostics